Back to all case studies

Case study

Aura Weather

A responsive weather dashboard designed for quick decisions: glance, understand the day, and move on. The strongest product story is trust: missing provider data is shown as unavailable instead of being coerced into fake zero values.

Project type
Weather dashboard and data-trust frontend project
Stack
React, Vite, JavaScript, plain CSS, Open-Meteo APIs
Primary focus
Scannable hierarchy, resilient async states, mobile usability, and honest data fallbacks
Last verified
with static page, asset, landmark, and console smoke checks.
Aura Weather current conditions and environmental exposure interface
Captured from the public live demo on May 12, 2026.

Data trust lens

The core challenge was making weather data fast to scan without pretending missing data exists.

Aura Weather needed to answer the user’s immediate question quickly while staying honest about provider limits. I designed the interface around current conditions, hourly trends, loading states, unavailable states, and API boundaries so missing values remain visible instead of being converted into misleading zeros.

Fast scanning

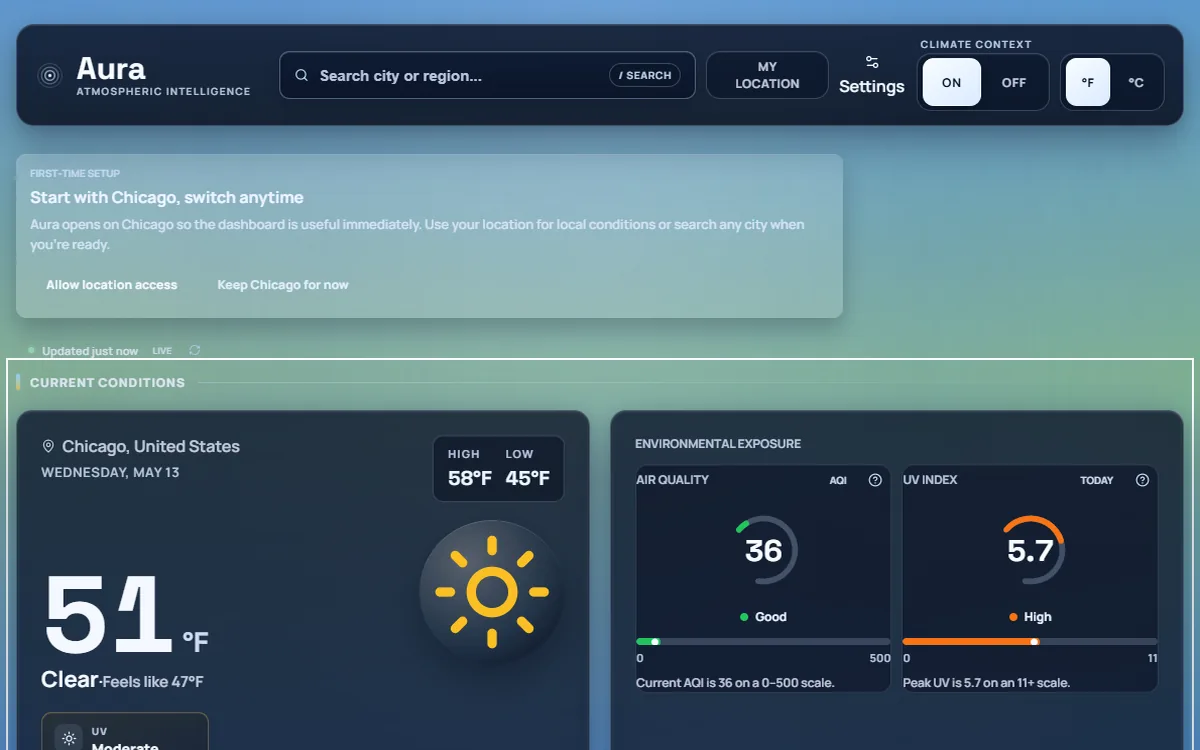
Current conditions, rain guidance, and hourly trends get visual priority.

Missing-data honesty

Unavailable provider values are shown as unavailable instead of fake fallback numbers.

API resilience

Separate data requests prevent secondary provider issues from blocking the whole experience.

Evidence Snapshot

Data experience built

  • Current weather summary
  • Hourly forecast hierarchy
  • City search
  • Saved-location behavior
  • Loading/error/unavailable states
  • API data normalization

What was hard

  • Keeping weather information readable without hiding useful detail
  • Representing missing provider data honestly instead of showing fake zero values
  • Making dense forecast content usable on small screens

Key decisions

  • Prioritized the current summary, rain guidance, and hourly trend
  • Separated provider data requests so one missing source does not block the whole UI
  • Used explicit unavailable states for missing data
  • Kept mobile controls touch-friendly for dense timelines

What changed because of those decisions

  • The interface became easier to scan quickly
  • The project demonstrates a trust decision around missing data
  • The case study focuses on resilient frontend behavior, not only visual polish

What to verify in 90 seconds

  • Open the live demo
  • Review current conditions and hourly forecast hierarchy
  • Try city search or saved-location behavior
  • Inspect responsive layout
  • Review the GitHub repo and case study notes

Current proof available

  • Live demo
  • GitHub repo
  • Case study
  • QA notes
  • Last verified date

Proof still needed

  • Needs capture: Lighthouse report screenshot
  • Needs capture: axe accessibility scan screenshot
  • Needs capture: Responsive screen captures
  • Needs capture: API state screenshots
  • Needs capture: Repo structure screenshot

Weather Data Trust Problem

Weather apps can become visually busy while still failing at the basic question: what does the user need to know right now? A second issue is data trust. When APIs return partial or missing values, the interface must not silently display fake readings.

Still to validate: real user behavior around saved cities, location permissions, and which weather panels people use most often.

Users

  • People who want a fast, readable weather snapshot before making daily decisions.
  • Mobile users scanning current conditions, hourly changes, rain guidance, and alerts.
  • Technical reviewers evaluating async data handling, API boundaries, and fallback states.

Fast-Scanning Goals

  • Make the current day understandable quickly without burying the answer in decoration.
  • Keep forecast, air quality, alerts, and climate context resilient when one source is slow or unavailable.
  • Represent missing data as missing, never as a confident zero.
  • Keep the responsive layout useful from desktop down to small mobile screens.

My Role

I built the frontend experience: dashboard layout, city search, saved-location behavior, weather API orchestration, data normalization, missing-data rendering, responsive CSS, interface states, and the QA coverage around the trust contract.

Scannability Decisions

  • Start with a usable fallback forecast instead of blocking the first load on geolocation permission.
  • Prioritize the hero summary, rain guidance, and hourly trend for fast scanning.
  • Use labelled unsupported or unavailable states instead of vague failure copy.
  • Add touch-friendly mobile sample controls for dense timelines that would otherwise rely on hover.

API Resilience Decisions

  • Separate forecast, supplemental data, and climate archive requests so secondary API problems do not block the core forecast.
  • Normalize provider data at the API boundary with strict numeric handling so null values stay null.
  • Cache last-known forecasts with freshness limits for offline or provider-failure recovery.
  • Keep CSS co-located with components in the app project so dashboard surfaces remain maintainable as they evolve.

Missing-Data Tradeoffs

  • Constraint

    Weather data can be partial, delayed, or unavailable from individual provider endpoints.

  • Decision

    Normalize values at the API boundary and render unavailable data explicitly instead of forcing fallback zeros.

  • Tradeoff

    The interface stays more trustworthy, but the UI has to carry more clear empty and unsupported states.

Accessibility Considerations

  • City search uses keyboard-friendly combobox and listbox behavior.
  • Loading, refresh, error, and missing-data states use live status messaging where it helps.
  • Missing values include assistive text such as no data available instead of relying only on an em dash.
  • Preference-aware effects and mobile touch target work are marked for continued interface QA.

Performance Considerations

  • Core forecast content loads before lower-priority supplemental panels.
  • Lazy panels and deferred mounting reduce the amount of work needed for the first useful screen.
  • Unit toggles are handled client-side so changing F/C does not trigger unnecessary provider requests.
  • Service worker support is limited to the app shell; live weather data remains a network truth source.

QA Notes

  • Measured on May 12, 2026: the PR-branch static smoke test returned HTTP 200 for this page on desktop and mobile, with no console/page errors and no completed broken images.
  • Accessibility smoke check: one H1, skip link, main landmark, and labelled navigation were present in both tested viewports.
  • Evidence standard: missing-data behavior is described as a trust decision without inventing reliability metrics.
  • Still to validate: fresh production Lighthouse profiling, reverse-geocoding edge cases, and saved-city behavior with real users.

Current Status

Aura Weather is a working portfolio project with real API integration, resilient loading/error behavior, and documented limitations. It should not be described as a full production weather platform.

What I Learned

Data products need honest absence states as much as polished success states. Keeping null, unavailable, and delayed provider responses visible makes the interface more trustworthy than a cleaner-looking screen with misleading fallback values.

What I Would Improve Next

  • Refine image and paint-cost tuning after fresh Lighthouse profiling on production.
  • Improve reverse-geocoding for raw device coordinates.
  • Revisit saved-city sync if the project needs account-level trust rather than lightweight optional sync.
  • Use product analytics or user testing to decide which panels deserve the most visual priority.